What is CEIR?
(Korean Patent Application No. 10-2026-0208000)
CEIR is a technology researched in-house at PRIMARYSYSTEM that restores original vectors and certifies the minimum number of joins in a curve.
It can be used in many areas, such as restoring logos, typefaces, maps and graphs to match the original down to the pixel.
Choosing a map
OpenHistoricalMap is an open map project that lets you look at old maps year by year. Anyone can add data, but the rule of thumb is to leave alone anything someone else has already drawn or is still working on.
I started with the Gwanghwamun area on a 1936 map of Seoul. Someone had already drawn it, 1936 buildings included, from more detailed plans. A few towns in Belgium and the Netherlands were the same story. Then I found Colombo in Sri Lanka. Beira Lake, right in the middle of the city, was not on OpenHistoricalMap for any year, and nobody had edited the area in the last three months.
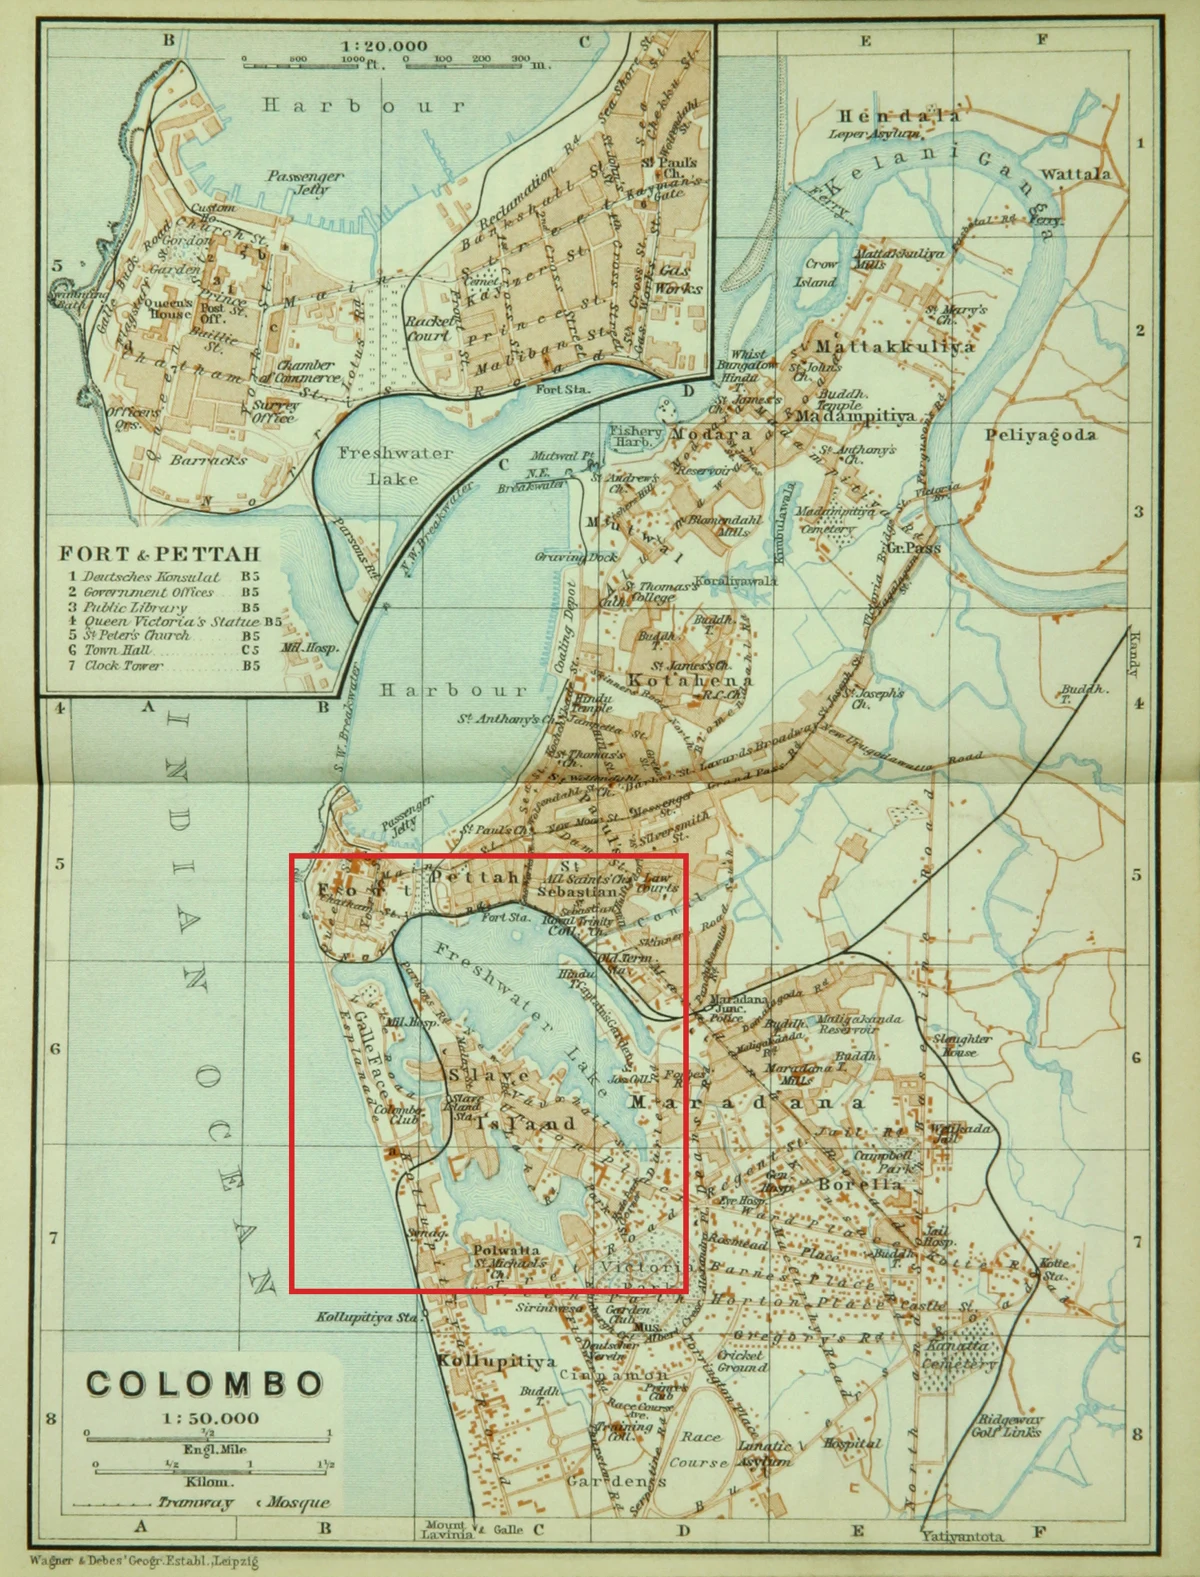
The map is the Colombo town plan in the 1914 India volume of the Baedeker travel handbooks, made by Wagner & Debes in Leipzig at 1:50,000. It is out of copyright and on Wikimedia Commons. The lake is printed in a single blue-green and labelled "Freshwater Lake". Today it is called Beira Lake.
Keeping only the water
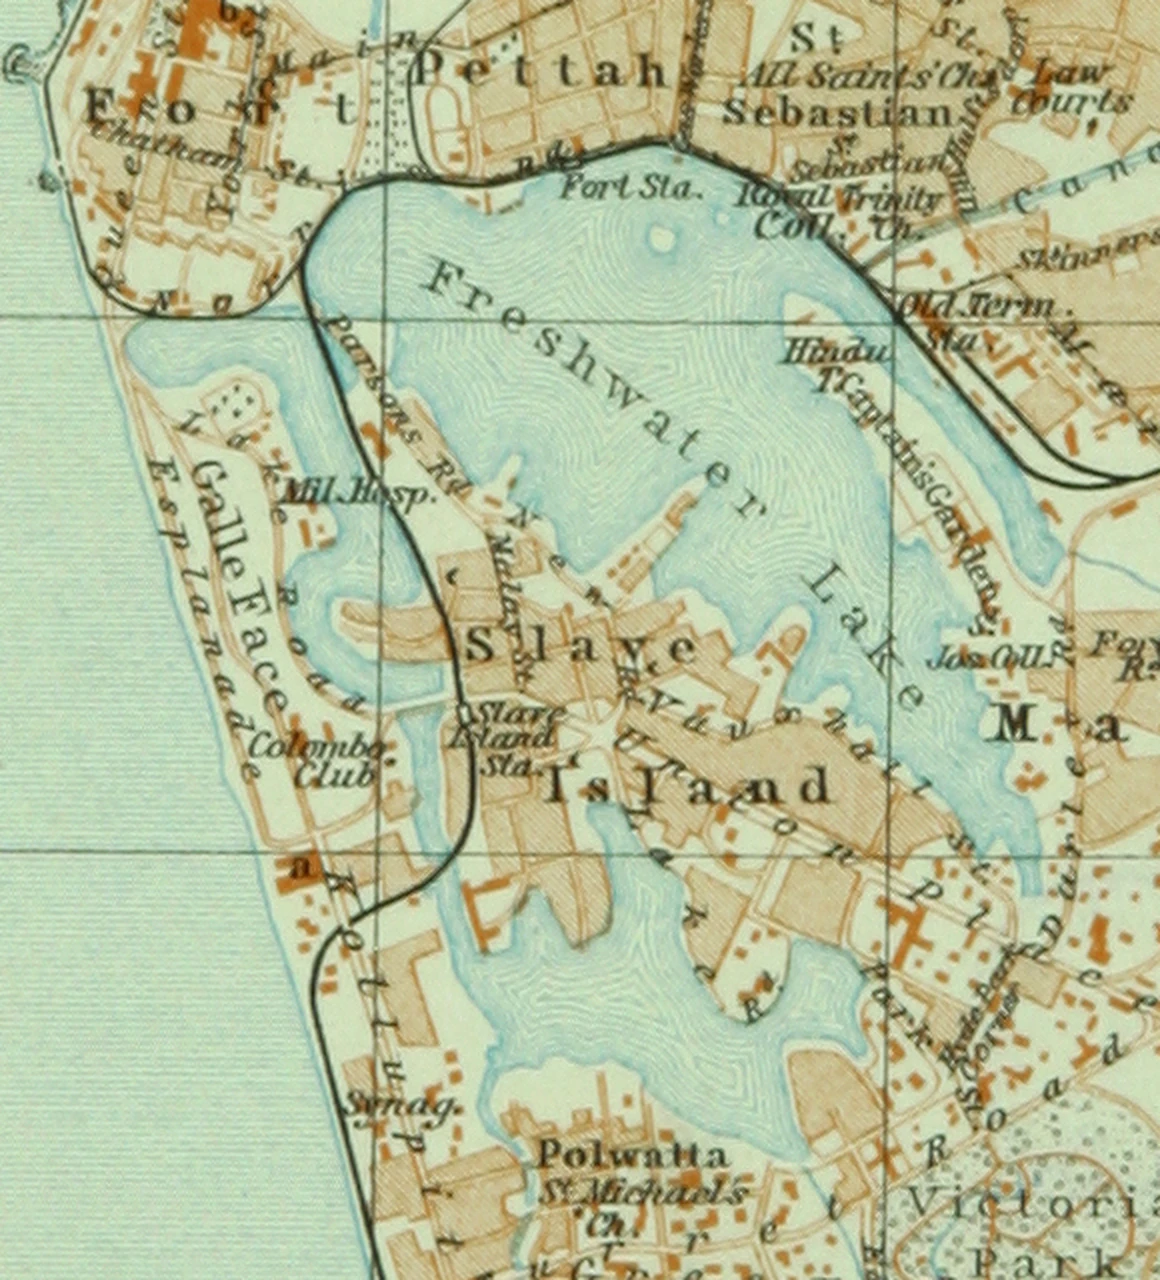
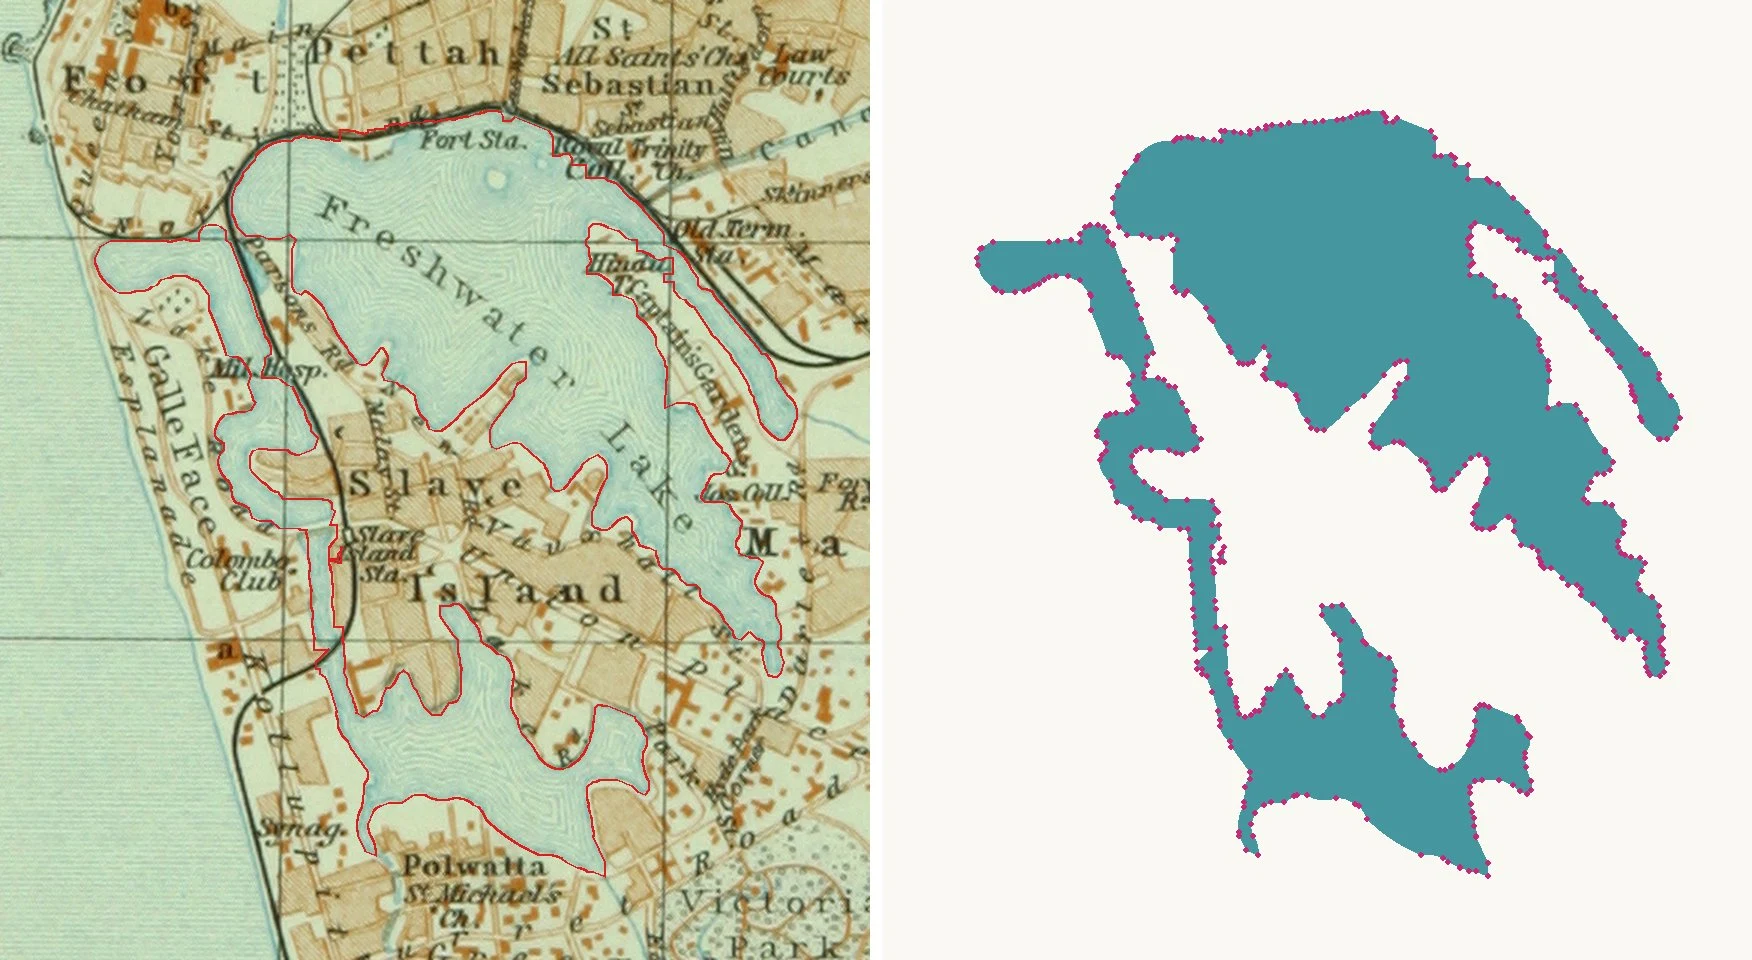
Cut out at 580 × 640 px, the lake has lettering such as "Freshwater Lake" and "Slave Island" printed over it, plus fine wave lines along the shore. Traced as it is, every word would leave a hole. So I picked out the blue-green first and filled the places the lettering and wave lines covered.
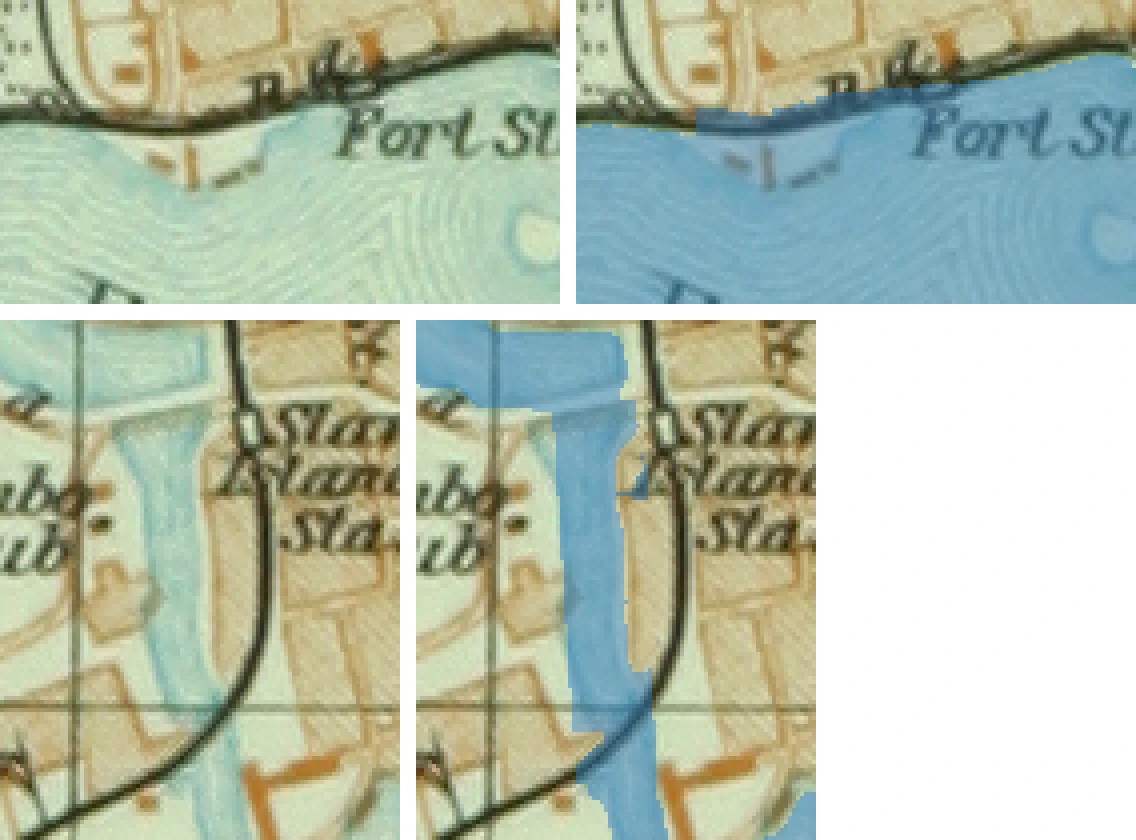
Two places I painted in myself after reading the map: the strip of water hidden under the words "Fort Sta." on the north shore, and the narrow channel beside the railway that joins the west arm to the southern lake. The "Hindu Tr." peninsula and the strip along "Parsons Rd" I left alone, because the map does not make clear whether they are land or water.
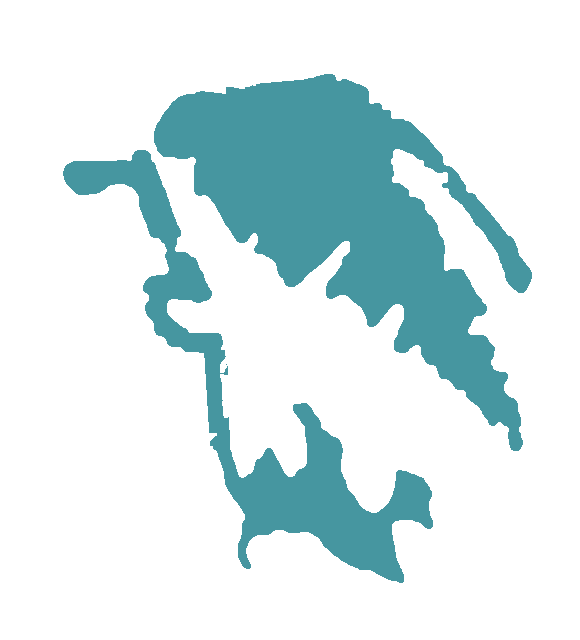
Tracing with CEIR
I traced that image with CEIR. The result is 2 closed shapes with 549 nodes: 192 curved runs became arcs and the other 357 straight segments. The outline sits on average within 0.2 pixels of the edge of the water colour, about 0.9 m at the map's scale.
Placing it on today's coordinates
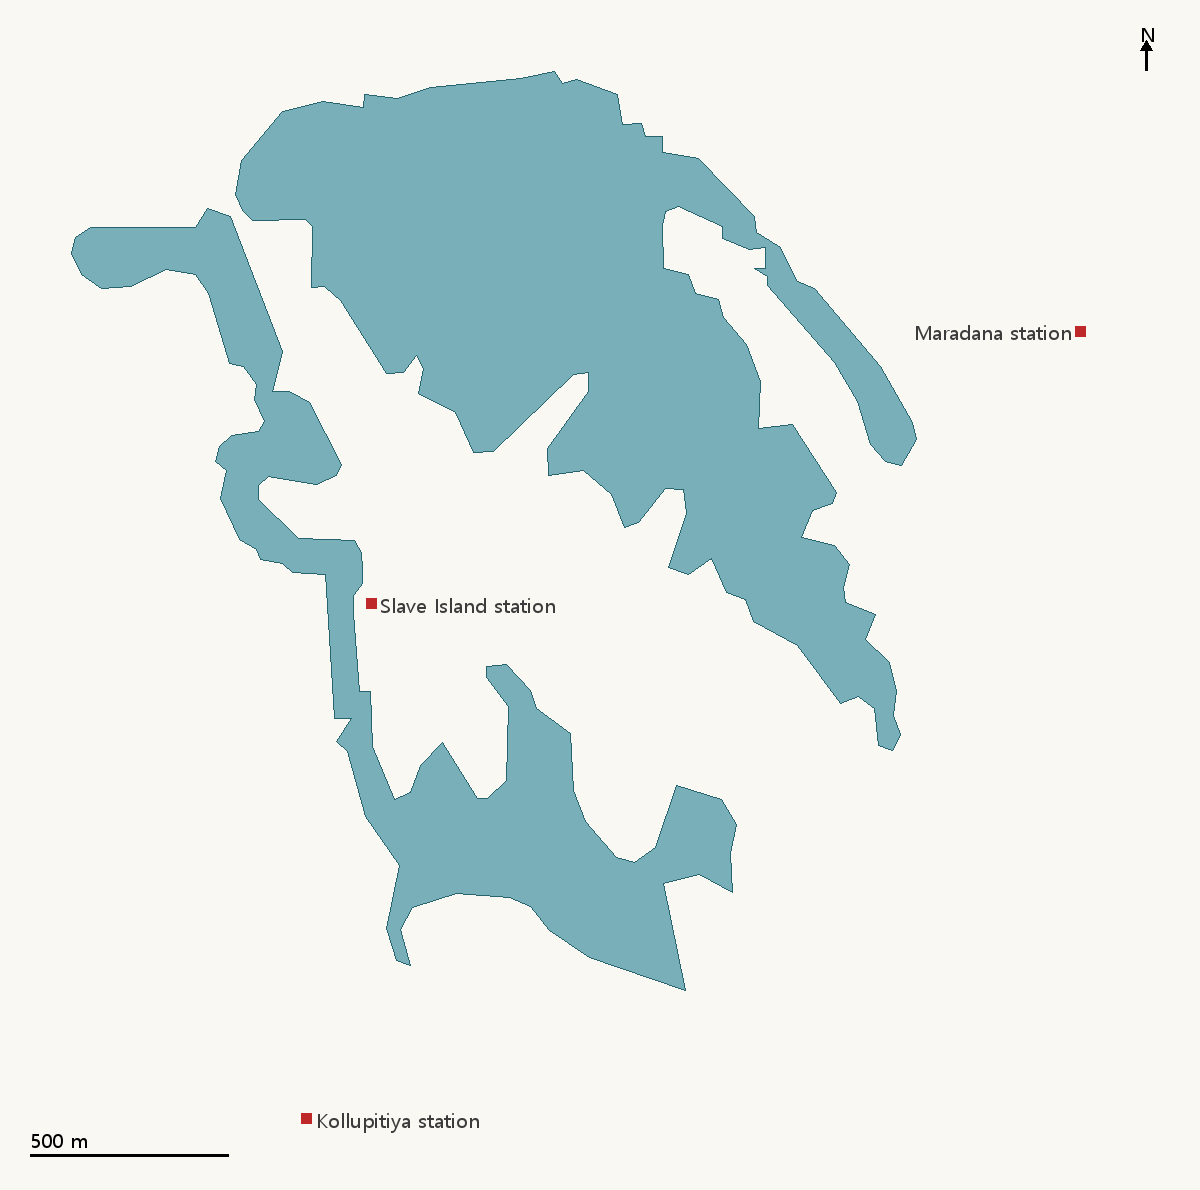
A 1914 map has no modern coordinates, so I used three railway stations that were there in 1914 and are still in the same place: Kollupitiya, Slave Island (now Kompannavidiya) and Maradana. Fitting scale and position gave 4.54 m per map pixel, with 37 to 71 m left over at the stations.
Laid over satellite imagery, the outline comes within 10 to 30 m of the shore wherever the 1914 shore still exists. The narrow arm in the north-east and the eastern part of the southern lake are now railway land, a sports ground and houses. They look to have been filled in after 1914.
Adding it to OpenHistoricalMap
I simplified the outline to a 12 m tolerance and added it to OpenHistoricalMap as two water areas. The main lake has 105 nodes and 113.3 ha; the west arm, channel and southern lake together have 92 nodes and 52.5 ha.
The only date on them is the map's year, 1914. There is no source for when the lake first took this shape or when it changed, so the data says no more than "this is how it was in 1914". Each area also carries a note that it is the map's drawing, not a survey, and may be off by about 50 m.
You can see them on OpenHistoricalMap: the main lake and the west and southern lake. The SVG, DXF and GeoJSON files are in the restoration community post.
For logo, type or map restoration, please write to contact@primarysystem.kr.